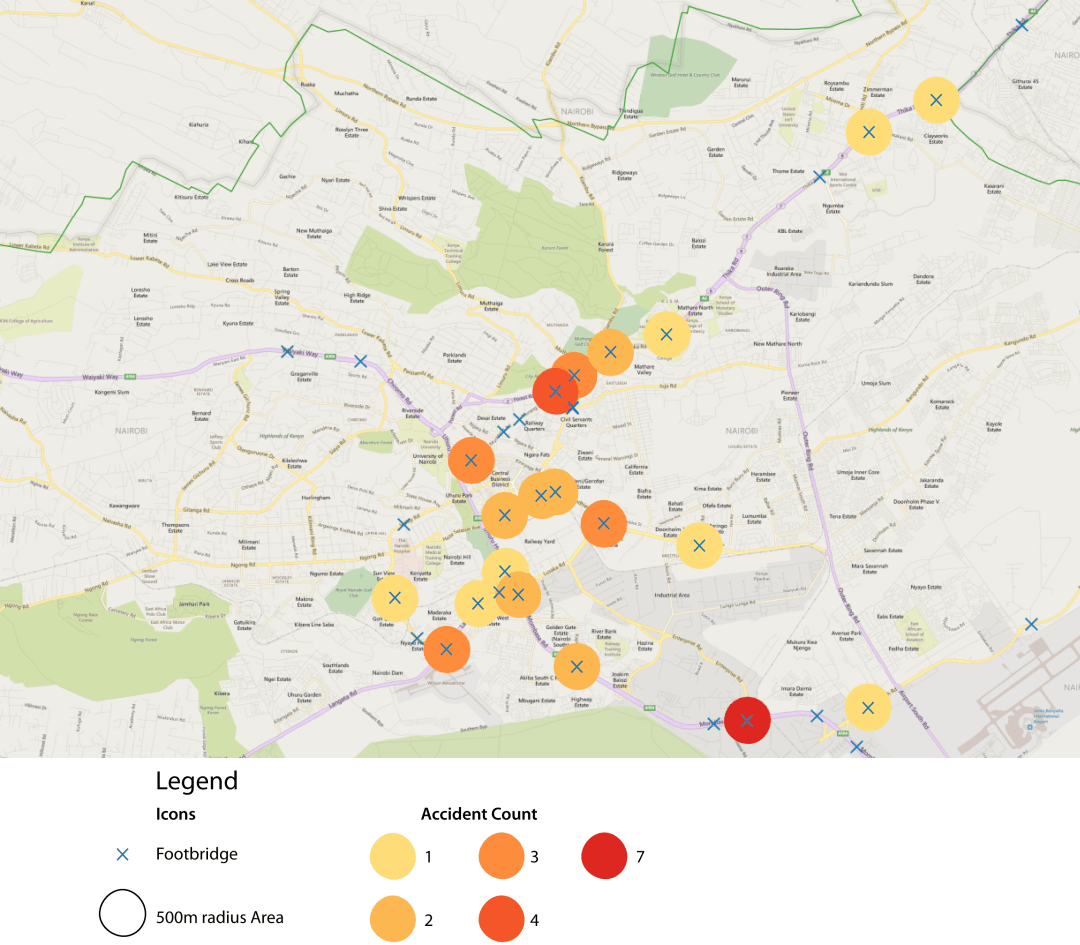
42.5% of accidents involving a pedestrian happened within 500 meters (a distance that takes about 15 minutes to walk) of a footbridge. This would suggest that footbridges are not a complete solution for preventing pedestrian accidents.
42.5% of accidents involving a pedestrian happened within 500 meters (a distance that takes about 15 minutes to walk) of a footbridge. This would suggest that footbridges are not a complete solution for preventing pedestrian accidents.
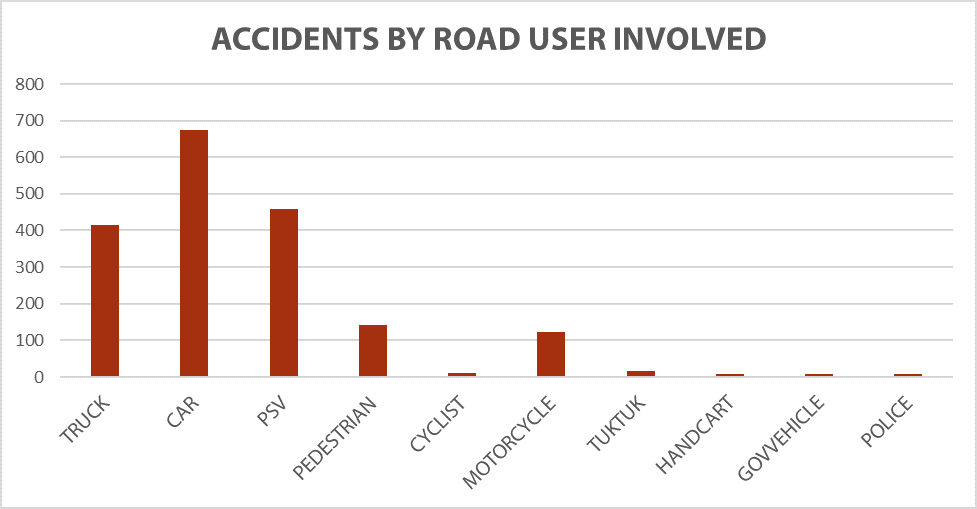
The above graph shows the number accidents involving each type of road users. Note that some accidents involved more than one type of road user and thus could be counted more than once (N=1339).
Although private cars are the type of vehicle most often in an accident, when taking into account the number of people affected by a single accident, PSVs affect the most people because they carry the most. In the graph below a conservative estimate of five passengers is used to demonstrate the comparative effect of PSV accidents versus those involving other road users.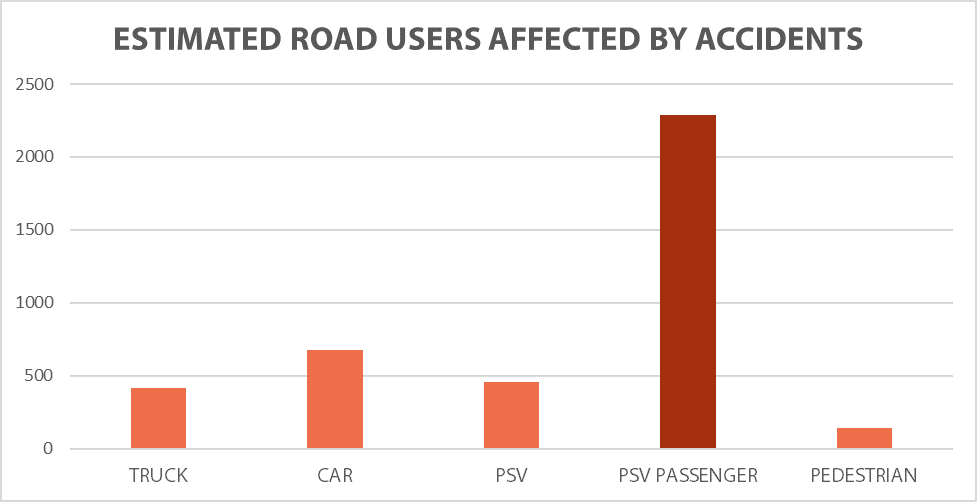

The graphic above shows all accidents in which a school bus or student was involved. Red icons indicate an accident with suspected fatalities.

PSV (public service vehicles) accidents affect the most people and are reported the more than accidents involving other road users. This map shows all the accidents in Nairobi County that involved a PSV (N = 253). The size of the dot represents the number of reports came in about a specific accident.
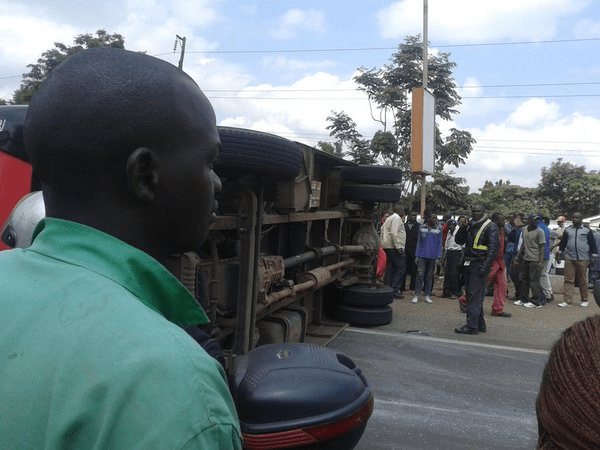
Because a map can obscure the human details of an event such as an accident, let’s look at some of the most reported accidents in more detail.


This map shows all accidents in Nairobi County by the type of road user involved. You can turn on and off layers to see different road users’ accidents. Note some accidents involved more than one type of road user and thus are represented more than once. Also, accidents in which the road user was not specified are not represented on this map (N=642).
