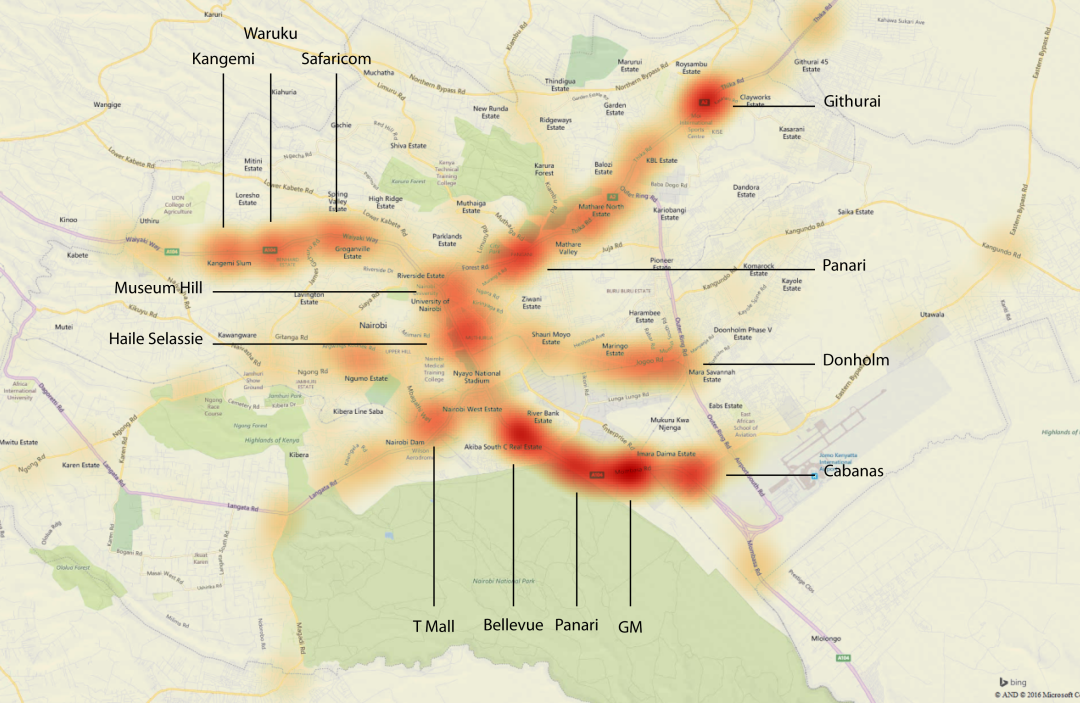
 Through this heatmap it is possible to see the major black spots (areas with higher than average accident concentrations) in Nairobi. The darker the area the greater the number of accidents.
Time-Lapse
This map shows all six months (May 2015 to October 2015) of accidents in Nairobi County. The time-lapse shows accidents by day, with new accidents layering on older ones to finally create a map of all six months of accidents.
Clustered Accidents
This map shows all 1324 accidents in Nairobi County clustered by proximity. Zoom in and out to see more or less detail.
Heatmap
This map shows the density of accidents in Nairobi County. Zoom in to see more detail.
All Road Users
This map shows all accidents in Nairobi County by the type of road user involved. You can turn on and off layers to see different road users’ accidents. Note some accidents involved more than one type of road user and thus are represented more than once. Also, accidents in which the road user was not specified are not represented on this map (N=642).
