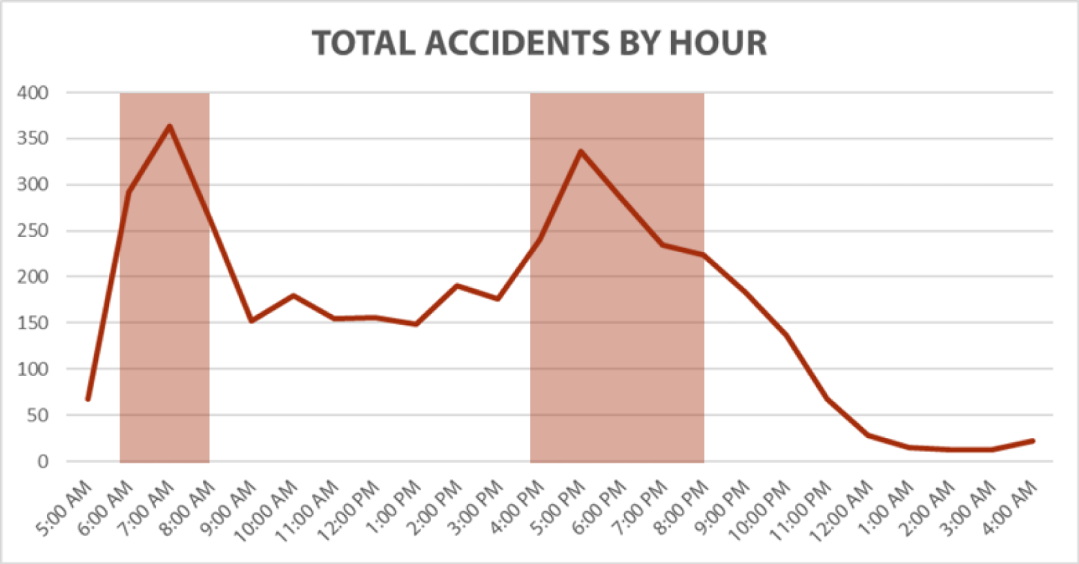
The above graph shows the total accidents (N=1,900) by the time they were first reported. Two clear peaks are evident during peak commuting (and traffic) hours.
The following graph shows that on average more accidents occur on Fridays and Saturdays.
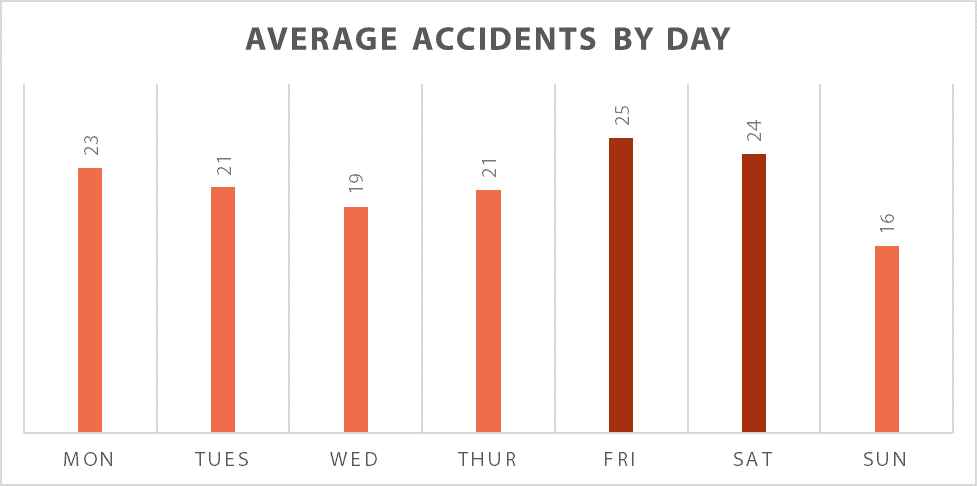
The above graph shows the total accidents (N=1,900) by the time they were first reported. Two clear peaks are evident during peak commuting (and traffic) hours.
The following graph shows that on average more accidents occur on Fridays and Saturdays.
